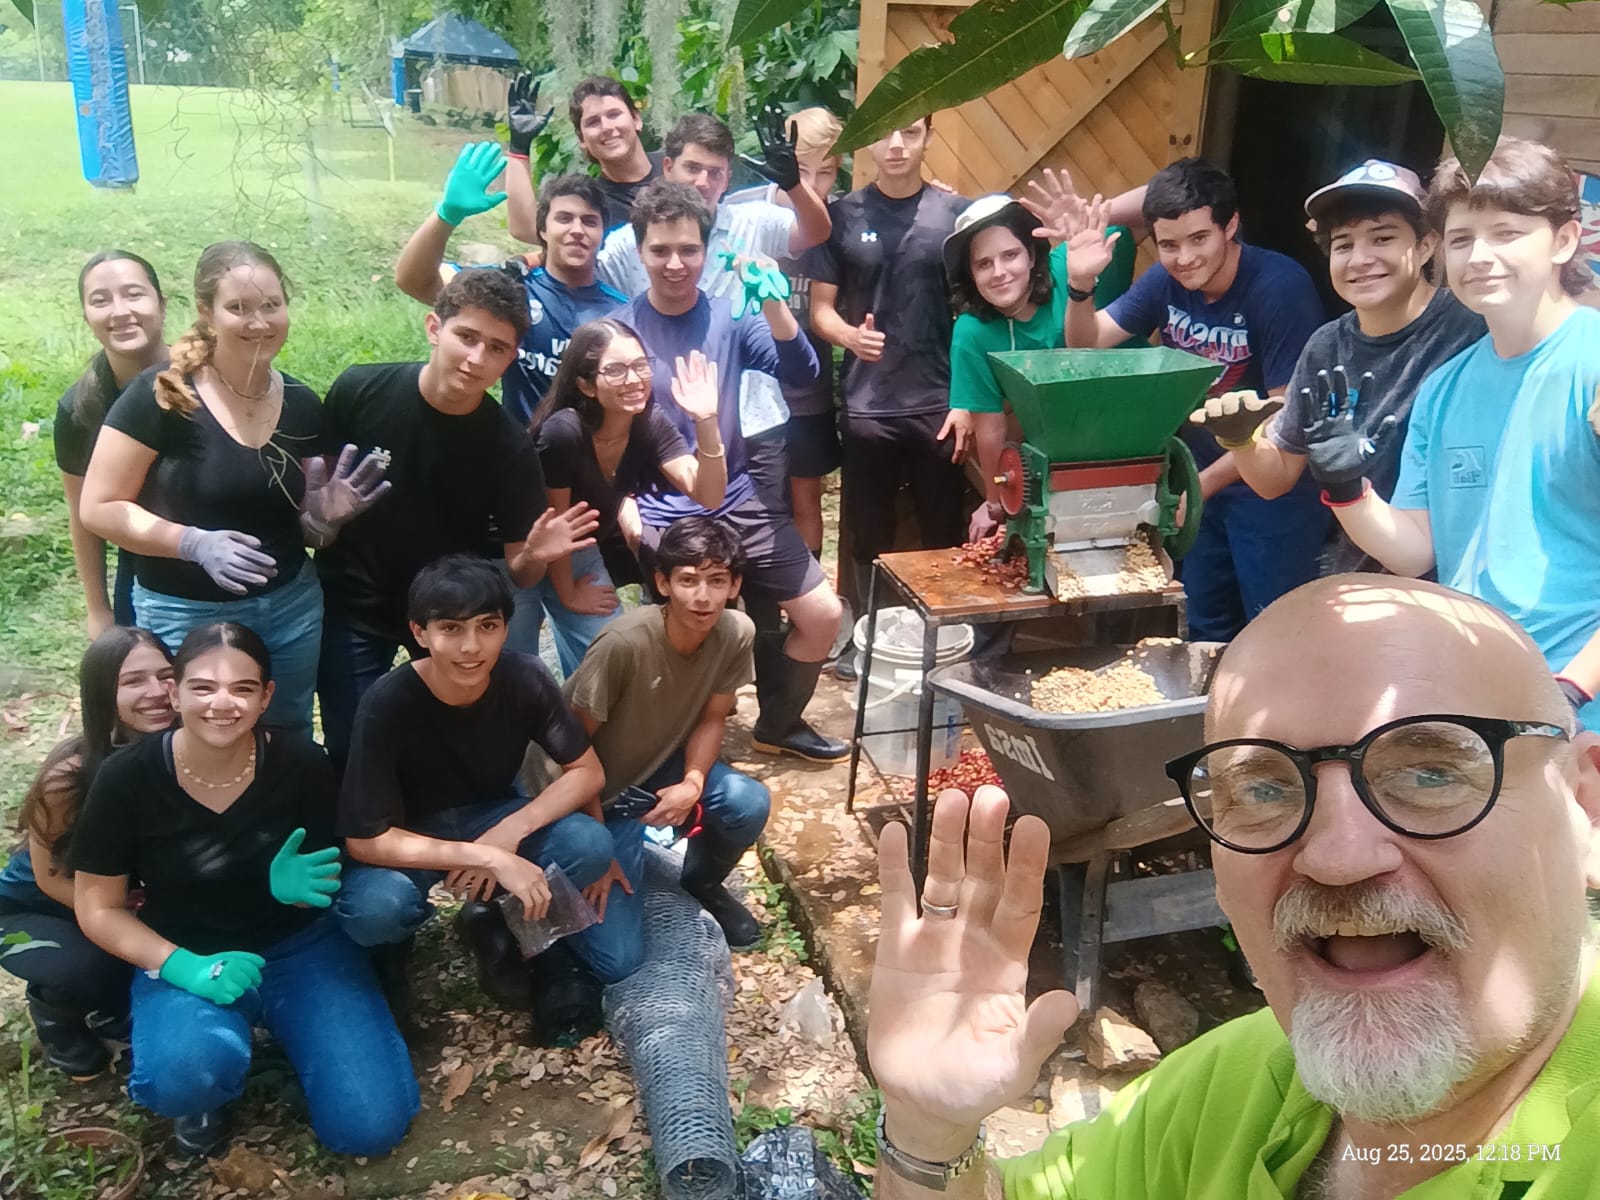
Sports day and competitive coffee picking
Another great day where the garden became a centre of inclusion and fun, a place for people to come together and this time in the name of Sports Day to get some good cardio exercise into the bargain! This year a new sport, CCC (Competitive Coffee Collecting) was tried at Colegio Bolivar and the results […]